Better Than the Competition? How to Calculate Switching Costs
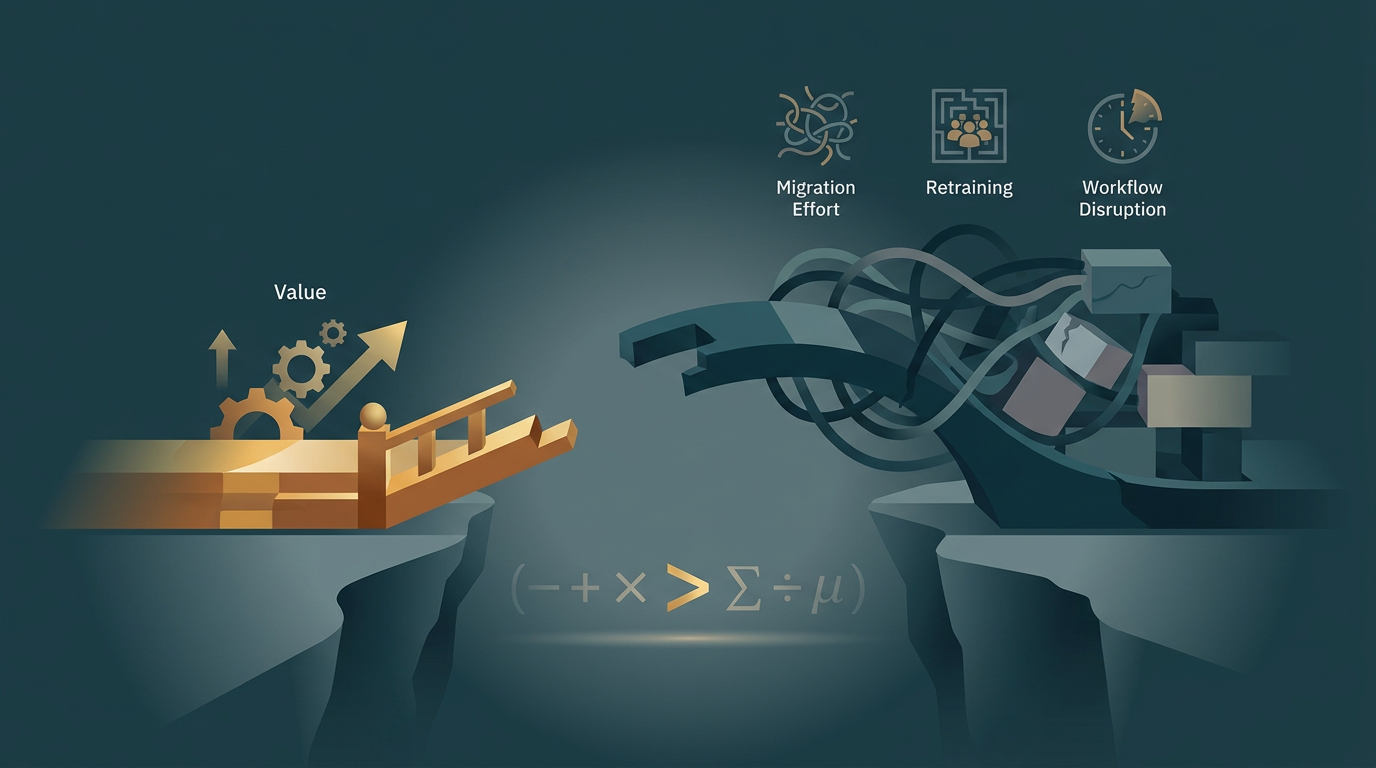
Being 20% better than your competition will not win you customers if switching to your product costs 30% of their annual productivity. To convince a buyer to switch, your product's value must not only exceed the incumbent's value, but it must also completely offset the total cost of switching.
Early-stage founders often fall into the trap of focusing solely on feature comparisons. However, a successful Go-To-Market (GTM) motion requires mapping out the exact friction a customer faces when ripping out their old solution. If you want to refine how your product sits in the market, your first step is conducting competitive analysis that actually changes your positioning. Once you know where you stand, you must calculate the migration barrier.
The Three Pillars of Switching Costs
When a B2B buyer considers your software, they are mentally calculating three hidden costs:
- Migration Effort: The hard technical cost of moving data, reconfiguring integrations, and setting up the new environment.
- Retraining: The time and capital spent teaching the team how to use the new system.
- Workflow Disruption: The temporary dip in output, lost sales, or operational friction that occurs while the team adapts.
Hypothetical Switching Cost Worksheet
To understand this from your buyer's perspective, use a switching cost worksheet. Below is a hypothetical example of a mid-market company switching their CRM.
Note: All numbers and scenarios below are illustrative and hypothetical. You should replace these with estimates gathered from your actual customer discovery interviews.
| Cost Category | Hypothetical Scenario | Estimated Cost |
|---|---|---|
| Data Migration | IT team spends 40 hours mapping and importing legacy records. | $4,000 (Internal IT cost) |
| Retraining | 20 sales reps require 4 hours of training each. | $4,000 (Lost selling time) |
| Workflow Disruption | 15% drop in outbound volume during the first 2 weeks. | $12,000 (Opportunity cost) |
| Total Switching Cost | $20,000 |
Calculating the Payback Period
Once you have the Total Switching Cost, compare it to the financial benefit your product provides.
For example, if your hypothetical CRM saves the company $50,000 a year in closed-won efficiency, you can calculate the payback period:
- Formula: (Total Switching Cost / Annual Savings) * 12 Months
- Calculation: ($20,000 / $50,000) * 12 = 4.8 Months
A payback period under 6 months is generally highly compelling for B2B buyers. If your hypothetical payback period stretches beyond 12 months, you will likely face severe sales objections, regardless of how good your features are.
How to Overcome the Switching Barrier
If your switching costs are too high, you must adjust your product or GTM strategy to lower the friction:
- Build Migration Tooling: Do not leave data import to the customer. Build one-click importers from your biggest competitors.
- Offer White-Glove Onboarding: Absorb the retraining cost by offering free, dedicated onboarding sessions for enterprise teams.
- Enable Parallel Runs: Allow customers to run your product alongside their legacy system for 30 days to mitigate workflow disruption fears.
Next Steps
Before your next sales call, map out your buyer's specific switching costs using the worksheet framework above. Identify the biggest source of friction—whether it's data migration or workflow disruption—and build a strategy to eliminate it. Once you know how to de-risk the switch, you can integrate this directly into your broader GTM strategy.
Build your Go-To-Market Strategy
Idea OS evaluates your startup across market sizing, ICP, competition, and more—then generates a GTM Strategy tailored to your evaluation.
Create my GTM Strategy →New to Idea OS? Start by evaluating your idea.